HomeBuilt with AIThis site's analytics

Something I built · Analytics

This site's analytics

Analytics that load only after consent, track a short list of actions, and arrive in my dashboard every morning.
Build2026
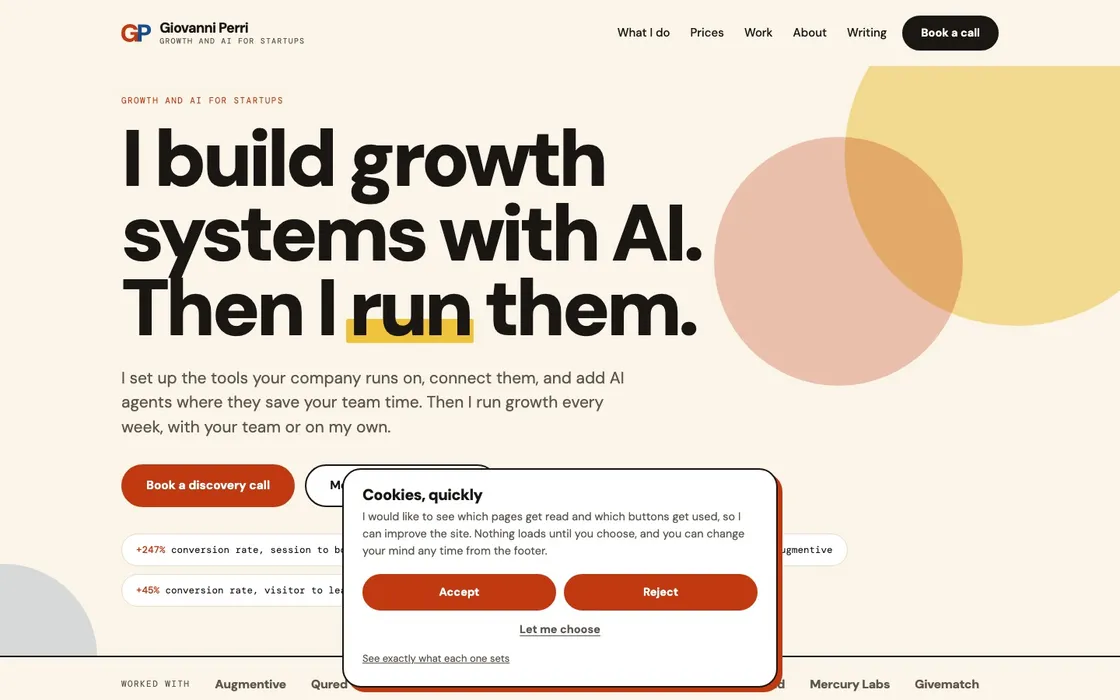
The giovanniperri.com homepage with the cookie banner open, showing Accept and Reject as equal buttons.

The cookie banner: nothing loads until you choose.

The company

I wanted to know which pages bring people to a call, without tracking anyone who has not agreed to it. The site follows the Italian data protection authority's cookie rules, so the banner offers Reject as clearly as Accept.

The brief

  • Nothing tracked before the cookie banner is answered.
  • Track only the actions that matter.
  • See the numbers every morning without opening an analytics tool.

Worked in

PostHogCloudflare WorkersCloudflare D1

What I did

Consent first

The analytics script is not on the page until a visitor accepts. Before that, no request goes to PostHog. Reject is the same size and weight as Accept.

A short list of events

Automatic capture is switched off. The site records page views and a few actions: clicks on a call to action, clicks through to book a call, newsletter sign-ups and case study views. That makes every number easy to explain.

The numbers come to me

Every morning at 7:00 my HQ dashboard asks PostHog for visitors, sessions, page views, the top pages and the booking clicks, and groups the traffic into channels such as search, social, email and AI assistants. It keeps 90 days of snapshots.

Inside it

What it looks like in use.
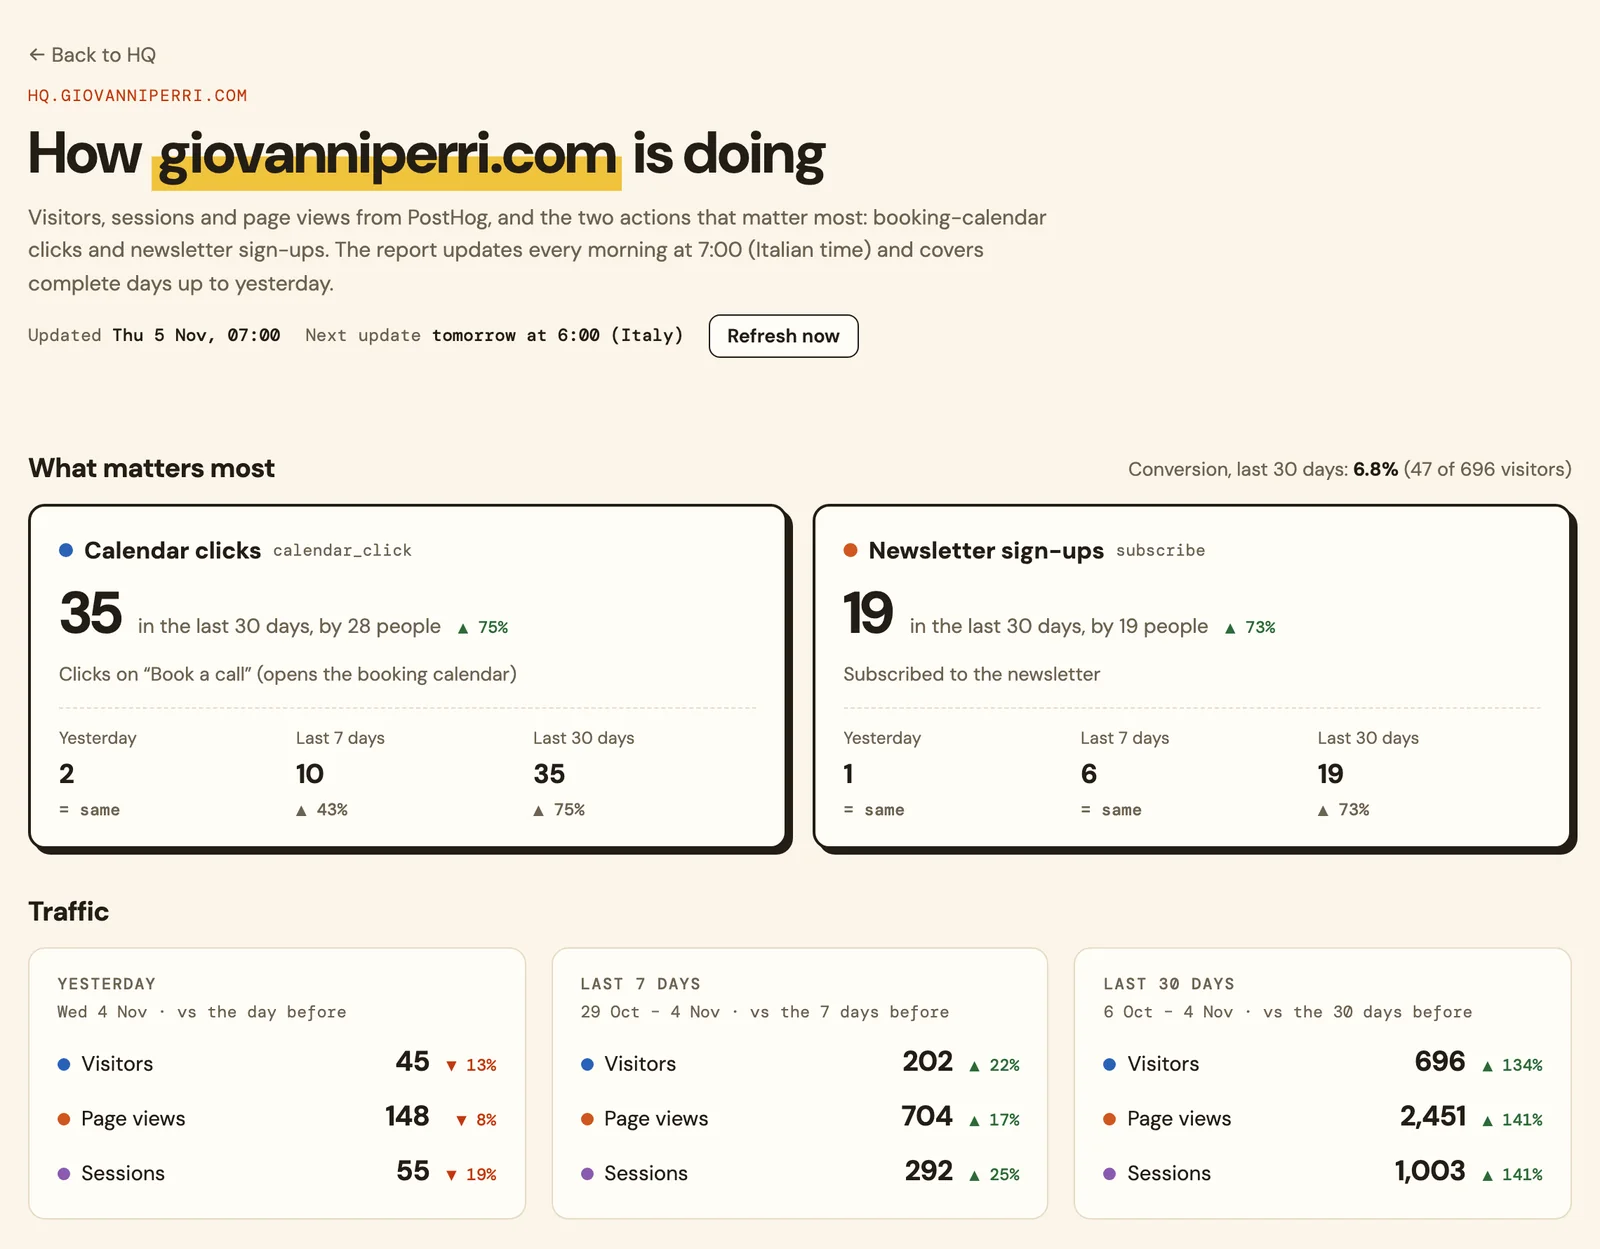
HQ · site analytics
The analytics page in HQ: calendar clicks and newsletter sign-ups for the last 30 days, then visitors, page views and sessions.
The report in HQ. It pulls from PostHog every morning, so I can see how the site is doing without opening PostHog. Figures made up for this page; the layout is real.
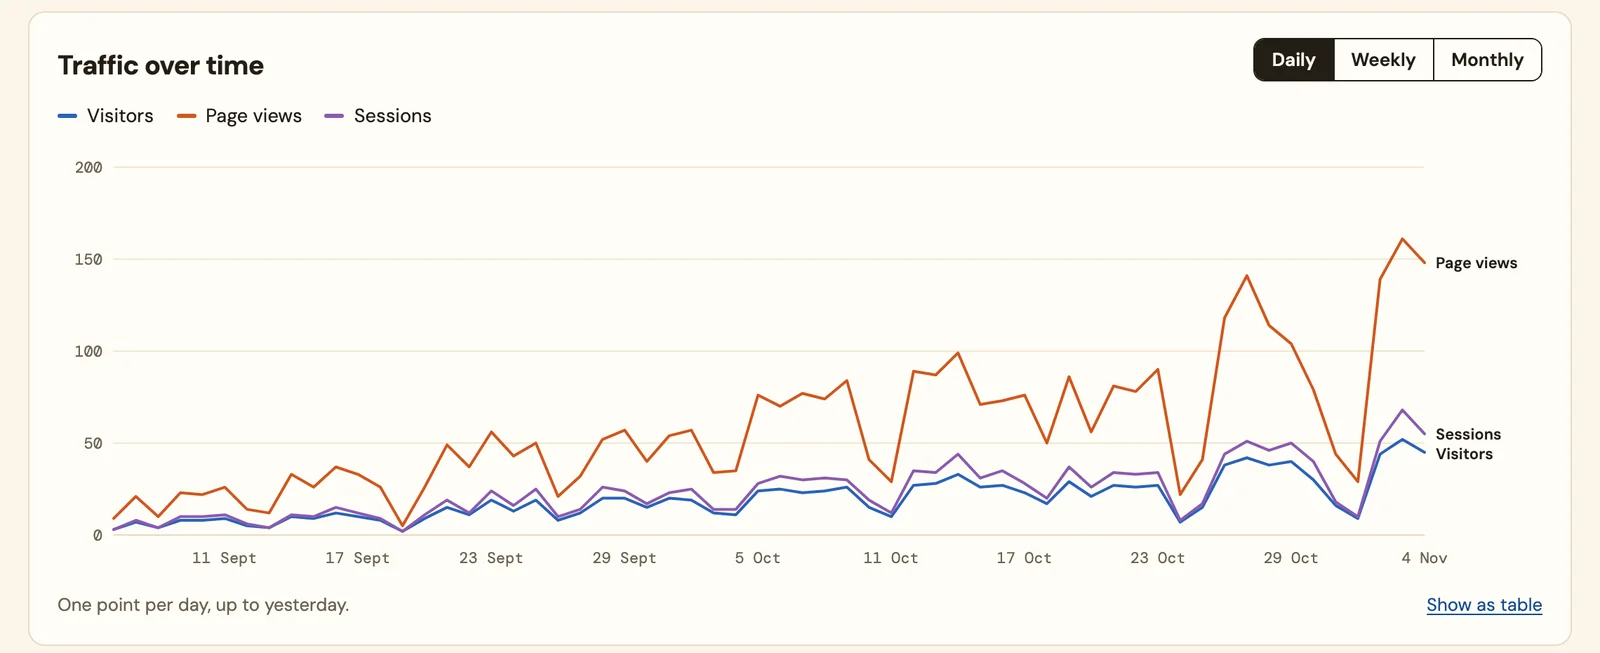
HQ · traffic over time
A line chart of visitors, page views and sessions per day over two months.
Visitors, page views and sessions per day. Figures made up for this page.
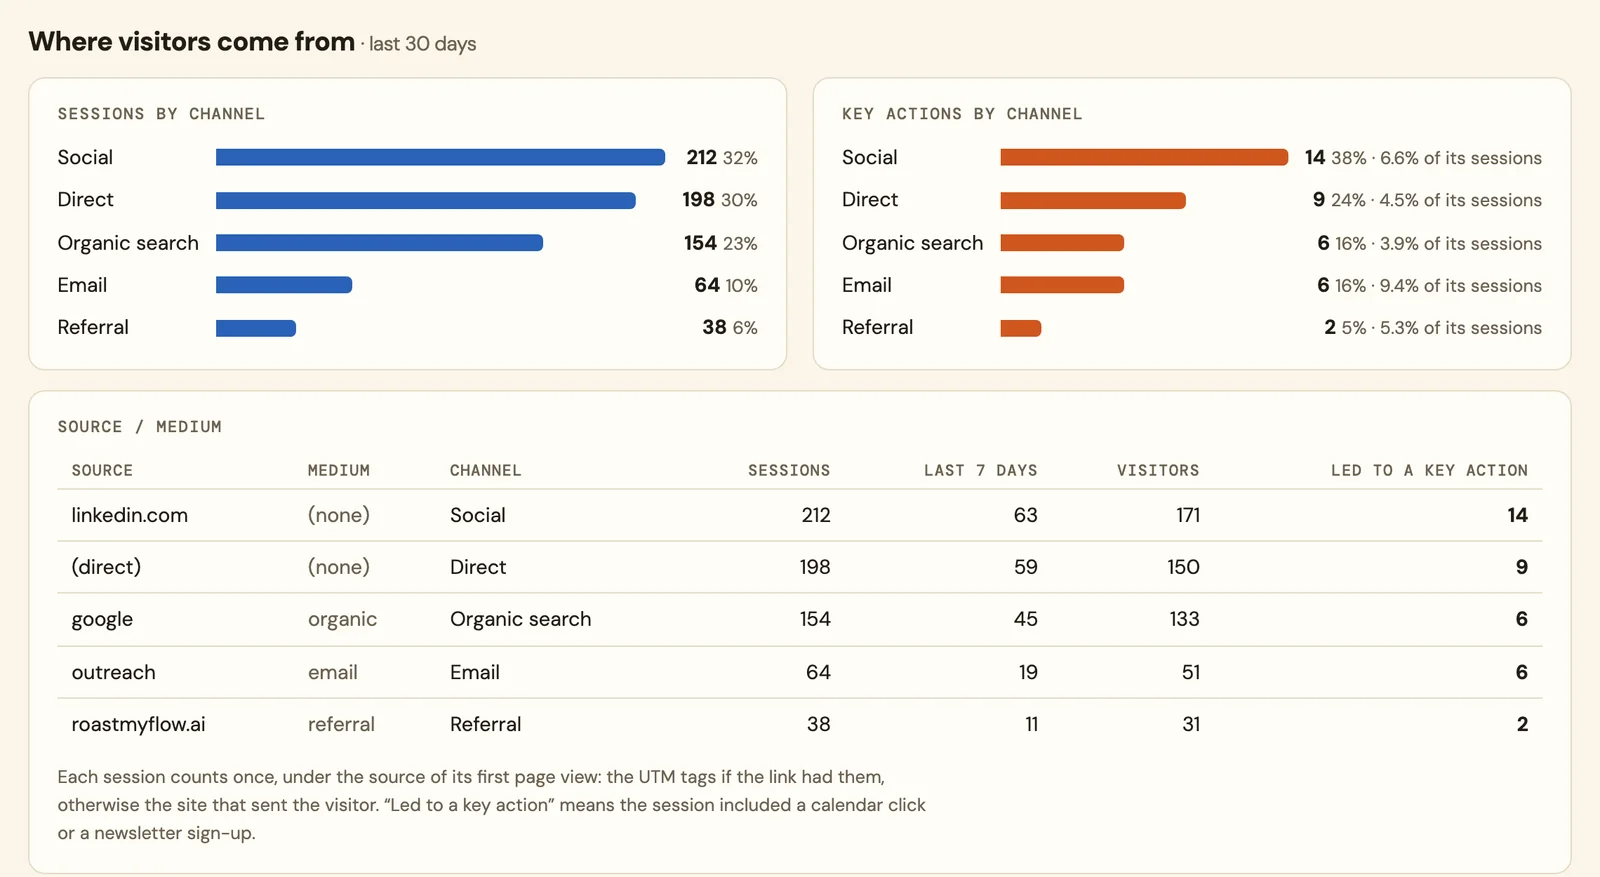
HQ · where visitors come from
Bar charts and a table of sessions by channel, and which channels led to a booked call or a sign-up.
Where visitors come from, and which channels lead to a call or a sign-up. Figures made up for this page.

What came of it

Results.

No tracking before consent, checked in the browser on the live site
A short, fixed list of events, the same list the privacy policy describes
A daily snapshot in HQ at 7:00, with traffic grouped by channel

Figures belong to this engagement and this client. Nothing here is an average or a benchmark, and no number appears without the work behind it described above.

What I took from it

Fewer events, all of them meaningful, beat a tool that records everything and explains nothing.

Giovanni Perri

Want one like this, for your team?

Tell me the job you want off your team’s plate. Most of these would be a Build, at a fixed price agreed before we start.