
Most founders know their sign-up number and their paying-customer number. Far fewer can tell me which step in between loses the most people. An onboarding funnel analysis answers that question, and it is usually the first piece of real work I do with a new client.
Below is the method I use, step by step, with a real funnel from a past client. I have removed the client’s name.
What is onboarding funnel analysis?
Onboarding funnel analysis means measuring how many new users complete each step between signing up and getting real value from your product. It shows you the step where the most people stop, so you know where to work first.
A typical onboarding funnel has four to six steps. For a software product, that might be signing up, confirming the email, completing the first setup task, reaching the first useful result and inviting a colleague or paying. Your own steps will be different, and agreeing them is the first job.
How I prepare before I look at any numbers
I spend the first part of the analysis away from the charts. Two things have to be true before a funnel report means anything.
I agree the steps in writing
I write the funnel down as a short table: each step, the event that marks it and what that event means in plain English. Then I ask the founder and the product lead to agree it. It sounds slow, and it saves weeks, because most arguments about conversion rates are really arguments about definitions.
At Givergy, I mapped the website in three stages, awareness, acquisition and activation, and we agreed them before we tracked anything. At Kudobuzz, I wrote the tracking plan for sign-ups and activation first, and only then built the email journeys on the same steps. I explain why that order matters in what I set up first.
I check that every step is counted correctly
A broken event looks exactly like a drop-off. If the “setup complete” event never fires on Safari, the chart will tell you that Safari users give up, and you will spend a month fixing the wrong thing.
So I go through the funnel myself, as a new user, and watch each event arrive. Then I compare the final step with the real number in the client’s own database. At Qured, the booking funnel was the whole business, and nothing was changed until the funnel matched real bookings. These are the six checks I run on GA4, and the same checks work in Mixpanel or PostHog.
A funnel analysis example, read step by step
This is a real funnel from a past client, a three-step journey from the homepage to a completed enquiry. It is an enquiry funnel rather than an onboarding funnel, but I read both in exactly the same way. It also shows an A/B test, which makes the reading more interesting.
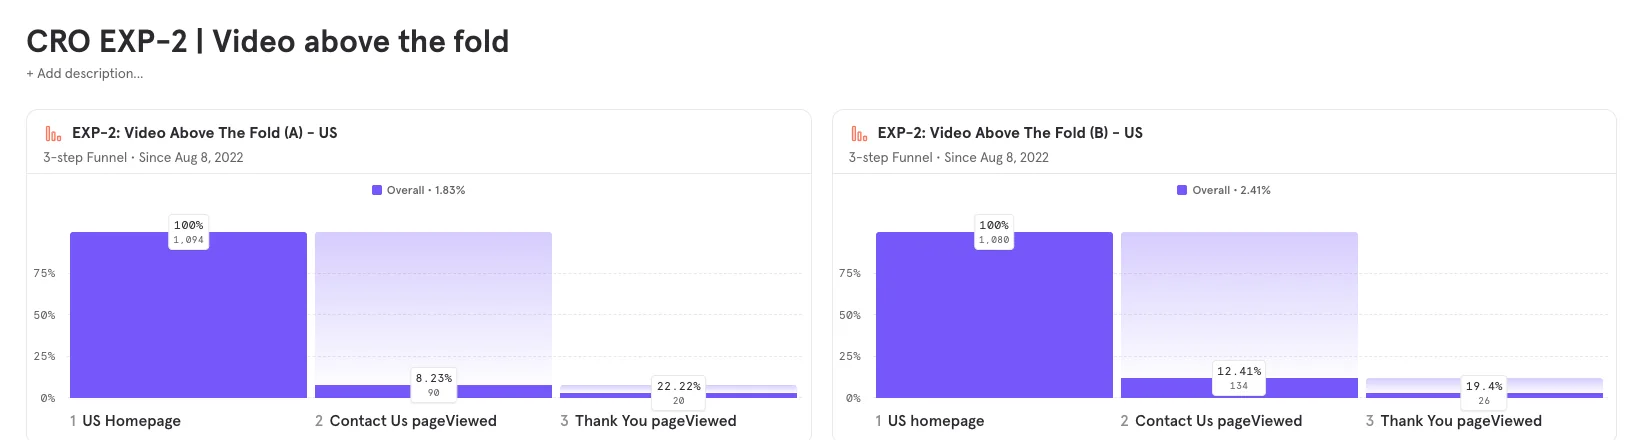
If I only read the overall rate, variant B looks like a clear improvement. It went from 1.83% to 2.41%, which means 20 enquiries out of 1,094 visitors against 26 out of 1,080.
The step-to-step rates tell a more useful story:
- Homepage to contact page. Variant B sent 134 of 1,080 visitors (12.4%) to the contact page, against 90 of 1,094 (8.2%) for variant A. The change on the homepage did its job.
- Contact page to enquiry. Variant B turned 26 of those 134 into enquiries (19.4%), against 20 of 90 (22.2%) for variant A. That step got slightly worse.
So the new homepage brought more people to the contact page, and a slightly smaller share of them finished. That tells me where the next idea should come from. The contact page now gets a different, perhaps less ready, group of visitors, and it may need to work harder for them.
I would also be careful with these numbers. Twenty and twenty-six enquiries are small counts, and a handful of people either way could change the picture. I explain how I decide when a test has a clear result in my post on experiments that build on each other.
How I find out who drops off, and why
Once I know which step loses the most people, I look at that step much more closely. The aim is to describe the problem in one sentence.
I split the worst step by who left
I break the drop-off down by the things that usually explain it: device, browser, traffic source, country and, in a product, the plan or the type of account. A step that loses half of mobile users and a tenth of desktop users is a mobile problem, and it needs a different fix.
I also check two settings that change the answer. The PostHog funnel docs explain both well. The conversion window decides how long someone has to finish before they count as a drop-off. The time-to-convert view shows which steps take people the longest, and a slow step is usually a hard step.
I watch the people who left
Numbers tell me where people leave, and recordings tell me why. I watch sessions of people who stopped at that step until I can name the problem. It might be a field people fill in twice, a confirmation email that never arrives, or a setup screen that asks for something they do not have yet.
I also go through the onboarding myself, with fresh eyes, before every analysis. I did this by hand for years, and then I built an AI agent that walks any flow on your website to do the first pass for me.
What I do with what I find
The analysis ends with a short list, and each item has the evidence next to it. I usually sort the findings into three groups:
- Broken things. An event that fires twice, an email that lands in spam or a button that does nothing on one browser. These get fixed straight away, without a test.
- Ideas worth testing. Changes where the evidence is good but the right answer is unclear. These go into the testing backlog, scored on how much evidence sits behind them.
- Help for people who stall. Some people stop for reasons a screen cannot fix, so I add an email or an in-app nudge at the step where they stop.
Then the funnel becomes the chart we open every week. When a test goes live, we watch the step it was meant to move, and the steps after it, because a change that helps one step can hurt the next one. The example above shows exactly that.
When funnel analysis is the right tool, and when it is not
In my experience, an onboarding funnel analysis is worth doing when:
- New users sign up regularly, and you want more of them to reach the moment where the product proves its value
- Your tracking records each step of onboarding as its own event, or you are ready to add it
- Nobody can say for certain which step loses the most people
It is probably the wrong place to start when:
- You only get a few sign-ups a week. The rates will jump around too much to read. At that stage, I would watch session recordings, go through the onboarding myself, and fix the obvious problems without pretending they were tested.
- People get through onboarding but do not stay. Then the problem sits later, in the weeks after sign-up, and that needs a different analysis.
- Your tracking is not set up yet. In that case the first job is the setup, which is what a growth setup Build covers.
How I would look at your onboarding
This is the kind of work I do every week on Run when you have a team that can build the changes. I own the analysis, choose what to test, brief your designers and developers, and read the result with you at the weekly growth session.
If your onboarding is losing people and nobody is sure where, have a look at how I work as a fractional Head of Growth, or book a thirty-minute call below. I will tell you honestly whether the funnel is the right place to start.
the overall rate tells you how much you lose, and the steps tell you where
Questions people ask
What is a good conversion rate for an onboarding funnel?
Which tool do I need for onboarding funnel analysis?
How much data do I need before I read a funnel?
How often should I look at the onboarding funnel?

I build growth systems with AI for UK and English-speaking startups, then run them with your team or on my own. More about me · how I work.
Written November 2026. Platform facts checked at the time of writing; if you are reading this much later, check them again.